
Build Your Own Palworld Server, Part 4: Power Control, Server Console, and a Live Map
Published 2026-07-13 · SameOS Tools
The admin page from part 3 turned the REST API into buttons. Run it for a while, though, and two needs come up that REST alone cannot cover - changing settings and starting a stopped server. This part solves both, then adds the two features that turned out to be the most fun: a server console and a live map.
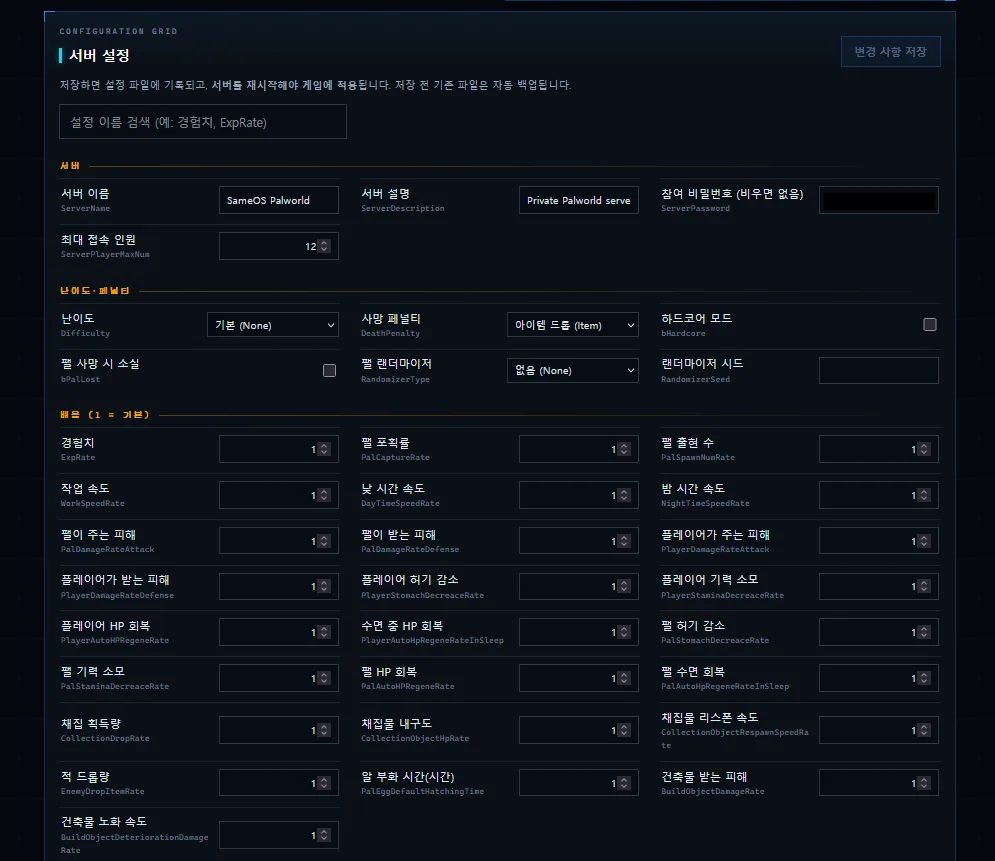
Beyond REST, One - Settings Editing
The REST settings endpoint (/settings) is read-only, so settings cannot be changed through it. My settings editor has the relay modify the config file (PalWorldSettings.ini) directly instead - honoring the ownership trap from part 2: overwrite the contents in place rather than replacing the file, and copy the previous version into a backup folder first. Changes apply on the next restart.
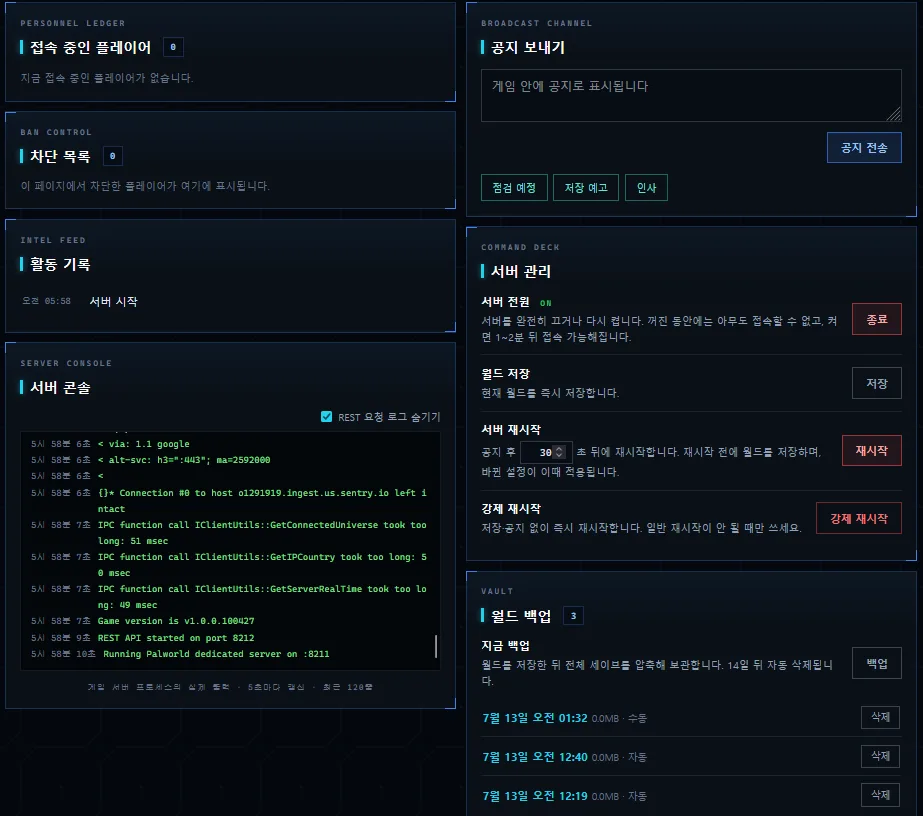
Beyond REST, Two - Power On/Off
A stopped server has no REST API at all. So the on/off buttons have the relay run docker start/stop. Stopping always announces and saves first, then calls docker stop. One warning: giving the relay Docker control is effectively giving it full control of the machine, which is one more reason this page must never be exposed to the internet.
The Server Console - Why the Text Breaks
A web console just relays the output of docker logs (the command that shows a container's records) - with one trap. Docker log data carries an 8-byte header on every chunk, so printing it raw sprinkles broken characters through the text. Strip the headers with the code below. Filtering out the status-check lines that repeat every few seconds makes the console far more readable.
The Live Map - Coordinate Conversion
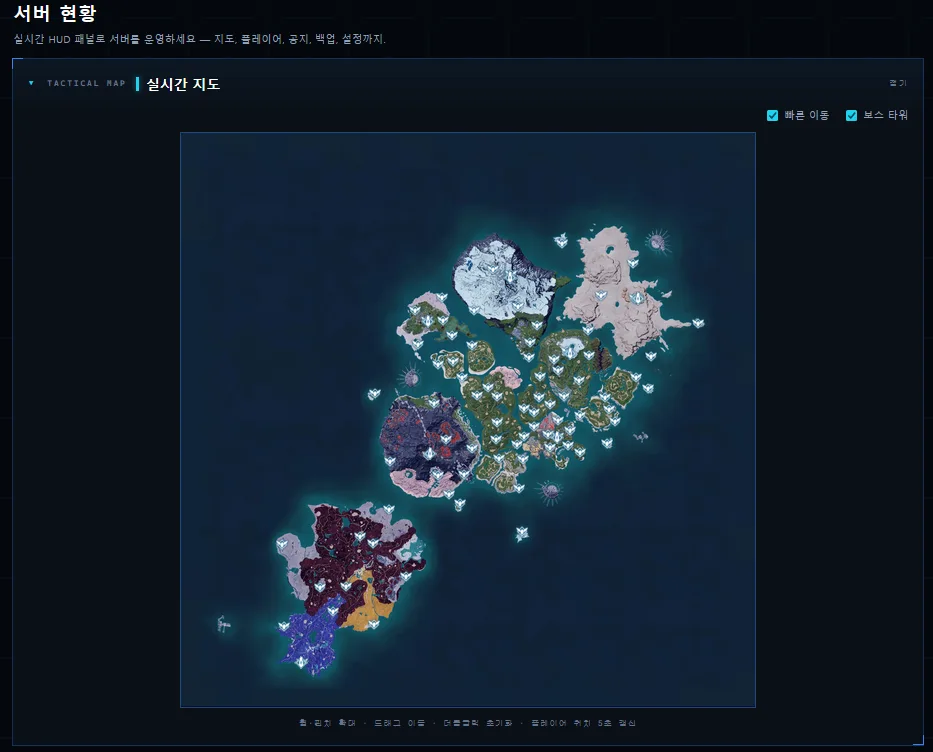
The player list (/players) includes each player's in-game coordinates, and the Palworld world is a square 1,447,840 units per side, so they convert to percentages over a map image. There is an axis swap - the game's north-south maps to the image's left-right - so the formula is unintuitive; use the code below as is. Drop dots on the map image and you can see who is playing where at a glance.
// Handling the docker logs stream - text breaks unless the 8-byte header is stripped
function demux(buf) {
    let text = '', i = 0;
    while (i + 8 <= buf.length) {
        const len = buf.readUInt32BE(i + 4);        // bytes 4-7: payload length
        text += buf.slice(i + 8, i + 8 + len);      // byte 0: stdout/stderr marker
        i += 8 + len;
    }
    return text;
}

// World coordinates (x, y) → percentages on the map image (side = 1,447,840)
// Mind the axis swap: the game's north-south maps to the image's left-right
function toMapPercent(x, y) {
    return {
        left: (y + 738920) / 1447840 * 100,
        top:  (1 - (x + 999940) / 1447840) * 100,
    };
}

// Usage: place each player from /players as a dot on the map
// const { left, top } = toMapPercent(p.location_x, p.location_y);
// dot.style.left = left + '%'; dot.style.top = top + '%';
That completes the series. Server management is now all buttons in the browser, and the map shows who is playing where at a glance. The full code for the series is on GitHub, and one-time-code admin login is covered in a separate article.